
Kiddom
August 7, 2026


The Grade 5 team meeting is going well, which is part of the problem.
Four teachers, eight minutes left, and everyone agrees Unit 6 is going fine. Fractions are hard. The kids are getting there. Mrs. Whitmore, in her fourth year as principal at Lincoln Elementary, believes them. She also has a feeling, assembled from three walkthroughs and one conversation near the copier, that one of those four classes is further behind than the other three.
She cannot prove it. Not in eight minutes.
So the meeting ends the way these meetings usually end. Someone will pull the numbers. It will take a few days, maybe a week. The answer will arrive as a slide in a deck, and by the time it does, Section B will be finished, and the team will have moved on to line plots.
That gap, between the moment a leader has a question and the moment the answer shows up, is where good decisions quietly go to die.
Ask the question, get the data visualized
KODA (Kiddom On-demand Analyst) is Kiddom's natural language analytics tool for administrators and teachers. You type a question in plain English inside Kiddom's reporting dashboard, and a table comes back. Nothing to configure. No report to request. No meeting to schedule with anyone at Kiddom to answer a routine question about your own school.
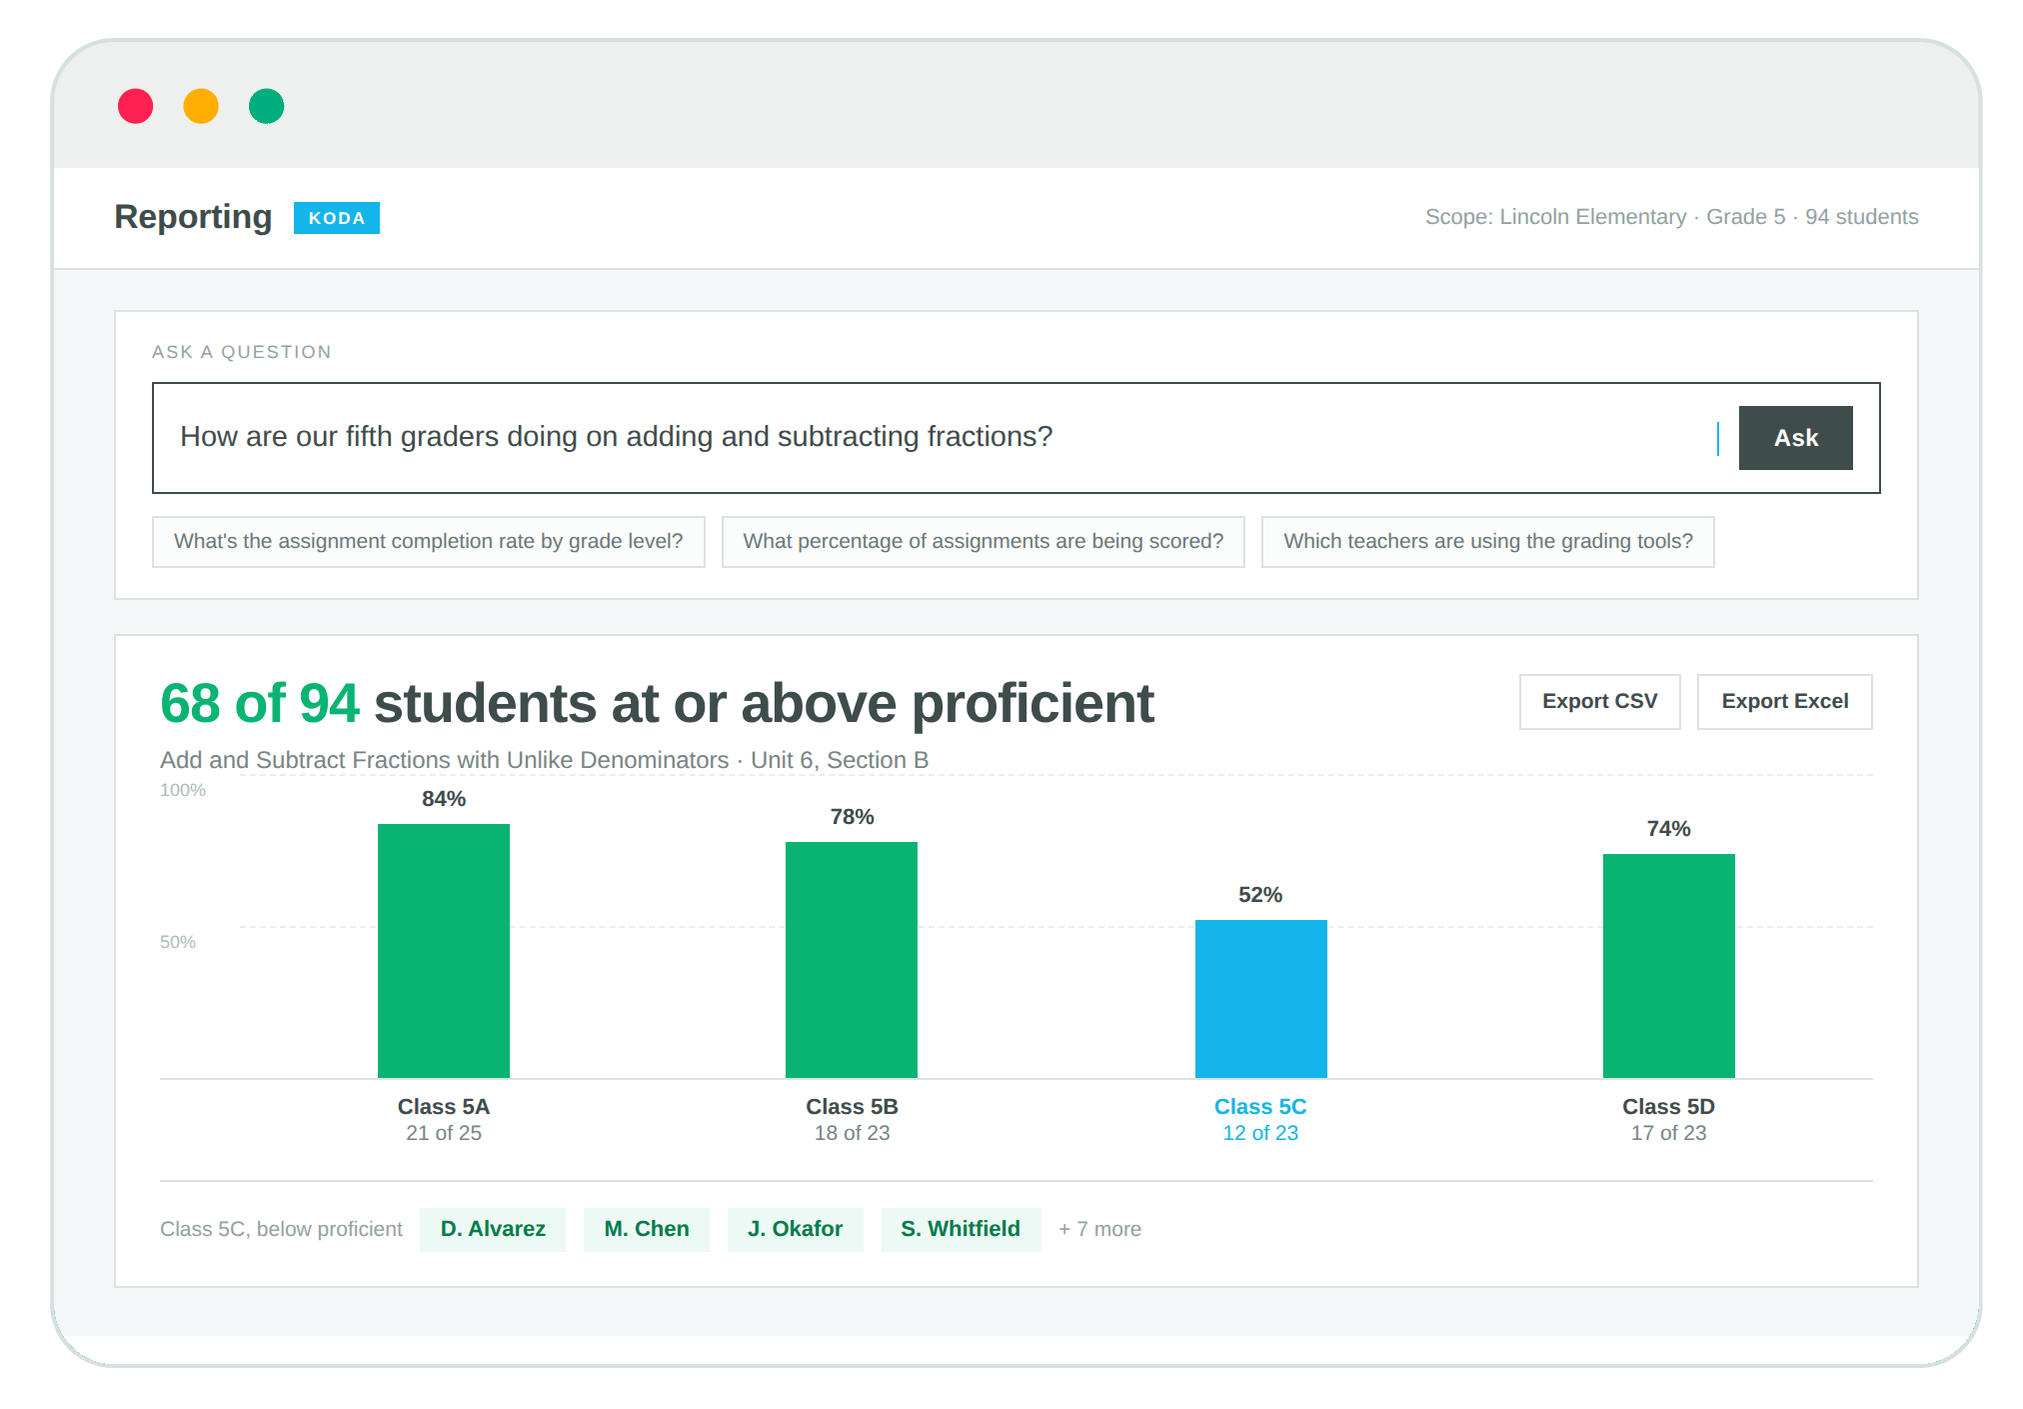
Dana types the question she could not answer in the meeting.
How are our fifth graders doing on adding and subtracting fractions?
The answer comes back as a table, broken out by class. 68 of 94 students are at or above proficient on Add and Subtract Fractions with Unlike Denominators, Section B of Unit 6. Three classes land in the seventies and eighties. One sits at 52 percent. She clicks that bar and gets eleven names.
Eight minutes would have been enough after all.
The follow-up question is usually about adults
Later that week she asks a different kind of question, the kind that is really about implementation.
What percentage of assignments are being scored this month?
KODA returns 412 of 596, broken out by grade level. Grade 5 is not the problem this time. Grade 3 is. Then one more line appears beneath the dataset. 3 of 8 Grade 3 teachers have not used cool-downs this month.
That line is not advice. KODA does not rank teachers, forecast outcomes, or tell her which feature to roll out next. It reports one factual signal about what is not being used, then it stops. Whether those three teachers need coaching, a schedule fix, or nothing at all is Dana's call, because she is the one who knows two of them have been covering a long-term vacancy since October.
The same question at district scale
At the district office, the question gets wider.
Out of our schools, how many administered assessments this week?
14 of 21. Data parsed by school. From there, into a school, then a grade, then a class, then a student, and the trail never dead-ends. On Friday, the whole view exports to Excel for the board packet, which used to be the job that ate Thursday night.
Every answer arrives as a ratio
Notice what those three answers share. Not "14 schools." 14 of 21 schools. Not "412 assignments scored." 412 of 596.
That is deliberate. A raw count is close to useless to a leader. Fourteen schools is either good news or a fire, depending entirely on whether you run sixteen schools or sixty. KODA never returns a count without its denominator, because the denominator is where the meaning lives. It is also what stops a number from being repeated out of context three meetings later.
Nobody sees data they should not see
Three people, one question box, three different answers, because KODA knows who is asking.
A teacher sees her own classes and her rostered students. A principal sees their school. District admins and superintendents see every school in the district. No one sees across districts, and no teacher ever sees another teacher's students. That scope is enforced on the server, not in the browser, so nobody widens it by editing a link.
One detail matters more than it sounds. A principal assigned to three buildings gets a school picker, not a blended average across all three. Blended averages hide the building that needs you.
And when KODA cannot answer something, it says so plainly. It tells you it could not find an answer, flags the question to the Kiddom team, and we follow up. If you are about to put a number in front of a board, a gap you know about beats a data display that is wrong.
When to reach for it
Whenever the question shows up, which is the entire point. Three moments earn it most.
More than just the data
Dana did not walk out of that meeting with a strategy. She walked out with eleven names, on a Tuesday, with five lessons still left in the section.
That is the whole idea. The distance between having a question and having the answer used to be measured in days, and those days cost you the window where the answer still mattered. Now it is measured in the time it takes to type the question. The deciding is still yours. It was always going to be yours.
Learn more at go.kiddom.co/data-insights